We Don't Sell Investment
Philosophies. We Build
Investment Systems.
Every buy, sell, and rebalance is driven by quantitative models. No gut feelings. No key-person risk. The system is the strategy.
Why Momentum?
Momentum, the tendency of rising stocks to keep rising and falling stocks to keep falling, is one of the most persistent and well-documented anomalies in capital markets. It has been observed across geographies, asset classes, and time periods for over two centuries.
The momentum effect has been documented in asset prices dating back to the 1800s. Geczy & Samonov (2015) confirmed momentum across equities, bonds, currencies, and commodities over two centuries.
Nifty 500 Momentum 50 has outperformed the Nifty 500 in 98% of all 5-year rolling return periods over the last 20 years. On 3-year rolling: 84%. On 1-year rolling: 75%.
Momentum as a factor has delivered approximately 6.2% annualised excess return over size-based market cap factors since 1926, compounding into a massive divergence over decades.
The Momentum Advantage — Decades of Evidence
Momentum Factor Comparison in India (20 Years)
Nifty 500 factor indices compared. Historically, Momentum has delivered the highest rolling returns and the highest outperformance frequency across all timeframes.
- 1Y Avg Return
- 28.1%
- 3Y Avg Return
- 21.4%
- 5Y Avg Return
- 21.0%
- 1Y Win Rate
- 75%
- 3Y Win Rate
- 84%
- 5Y Win Rate
- 98%
- 1Y Avg Return
- 20.7%
- 3Y Avg Return
- 17.0%
- 5Y Avg Return
- 17.1%
- 1Y Win Rate
- 62%
- 3Y Win Rate
- 69%
- 5Y Win Rate
- 99%
- 1Y Avg Return
- 19.7%
- 3Y Avg Return
- 16.4%
- 5Y Avg Return
- 16.2%
- 1Y Win Rate
- 69%
- 3Y Win Rate
- 79%
- 5Y Win Rate
- 100%
- 1Y Avg Return
- 24.4%
- 3Y Avg Return
- 18.5%
- 5Y Avg Return
- 15.6%
- 1Y Win Rate
- 56%
- 3Y Win Rate
- 54%
- 5Y Win Rate
- 96%
How We Build Investment Models
We don't sell investment philosophies. We build, test, and deploy investment models. Every model at SAMCO is a complete system, not just a list of what to buy, but a precise answer to four questions.
- 1What to Buy
The investment universe. 750+ stocks across large, mid, small, and micro caps are filtered through risk screens to remove illiquid, circuit-hit, and red-flag names.
- 2When to Buy
Signal and confirmation system. Our proprietary 'Distinctive Patterns Model' screens the universe for momentum signals. Every signal requires a confirmation before execution.
- 3How Much to Buy
Weighting system. Position sizing is algorithmically determined, market-cap agnostic, sector-diversified, risk-controlled. No single conviction override.
- 4When to Sell
Switching and exit system. When momentum signals fade, the system generates switch trades automatically. Cash is freed by exiting, not by sitting on the sidelines.
100% model-driven. 100% tested. 0% random.
If any one of these four ingredients is missing, you don't have a systmatic investment approach, you have an opinion.
C.A.R.E. Momentum — Our Signal Architecture
Our momentum signals don't rely on a single dimension. C.A.R.E. captures four distinct layers of momentum, each validated independently, combined for conviction.
-
CCross-Sectional Momentum
Ranks stocks relative to the entire universe. Which stocks are showing the strongest price momentum compared to their peers? The classic Jegadeesh-Titman factor — the foundation of all momentum research.
-
AAbsolute Momentum
Is the stock rising in absolute terms, not just relative to peers? Absolute momentum acts as a regime filter: it keeps the portfolio in uptrending names and avoids catching falling knives during broad market declines.
-
RRevenue Momentum
Is the company's revenue accelerating? Revenue momentum confirms that price momentum is supported by fundamental business growth — not just speculative flow or momentum chasing.
-
EEarnings Momentum
Are earnings estimates being revised upward? Earnings momentum captures the analyst revision cycle — stocks with rising estimates tend to continue outperforming as the market prices in the upgrade.
Four signals. One conviction.
A stock must show momentum across multiple C.A.R.E. dimensions to enter the portfolio. Single-signal momentum is noise. Multi-signal momentum is edge.
From Universe to Portfolio — The 4-Stage Pipeline
-
STAGE 1Investible Universe750+ stocks across Large, Mid, Small caps750+ stocks
-
STAGE 2Risk FilteringRemove illiquid, circuit & red-flag stocks~500 survive
-
STAGE 3Signal ScreeningProprietary Distinctive Patterns Model~50-80 signals
-
STAGE 4Portfolio BuildMarket-cap agnostic, sector-diversified25-40 holdings
Never Override
Most fund houses hire star fund managers who make discretionary calls. We replaced discretion with discipline. The system selects. The fund manager executes. There is no "this time is different" exception.
Our fund managers are more like scientists than stock-pickers. They design, test, and refine the models. They don't override them. Their incentives are aligned to the system's performance — not to their personal conviction calls.
When Momentum Doesn't Work
We believe in being transparent about the risks. Momentum is not a magic formula — it is a factor with a strong long-term edge that occasionally underperforms, sometimes sharply.
Momentum experiences drawdowns during sharp market reversals. When markets crash and then rapidly reverse — as in March 2009, March 2020, or late 2022 — momentum portfolios can lag because they are positioned in the stocks that were rising before the reversal, not the beaten-down names that bounce hardest.
The Nifty 500 Momentum 50 has a maximum drawdown of -70.24% over the last 20 years, higher than Quality (-53.6%) and Low Volatility (-48.3%). Momentum's volatility (22.65% annualised) is also the highest among factors.
But the long-term evidence is unambiguous. Over 5-year rolling periods, momentum has outperformed the Nifty 500 in 98% of observations. The factor rewards patience and discipline — which is precisely what a systematic, non-override process provides.
This is why SAMCO's investment process includes stock-level hedging mechanisms and risk management guardrails designed to reduce the severity of momentum drawdowns while preserving the factor's long-term return advantage.
Worst-case scenario in 21 years
Sharp drop, rapid bounce
Orderly correction, steady recovery
Every drawdown in 21 years has been followed by full recovery. The system doesn't panic — it rebalances. Source: NSE, SAMCO Research. Past performance may or may not be sustained in future and is not a guarantee of any future returns
EMOSI — Equity Margin of Safety Index
SAMCO's proprietary indicator that oscillates between 0–200, helping investors decide how much to allocate to equities at any point. The higher the EMOSI, the more favourable the risk-reward for equity investment.
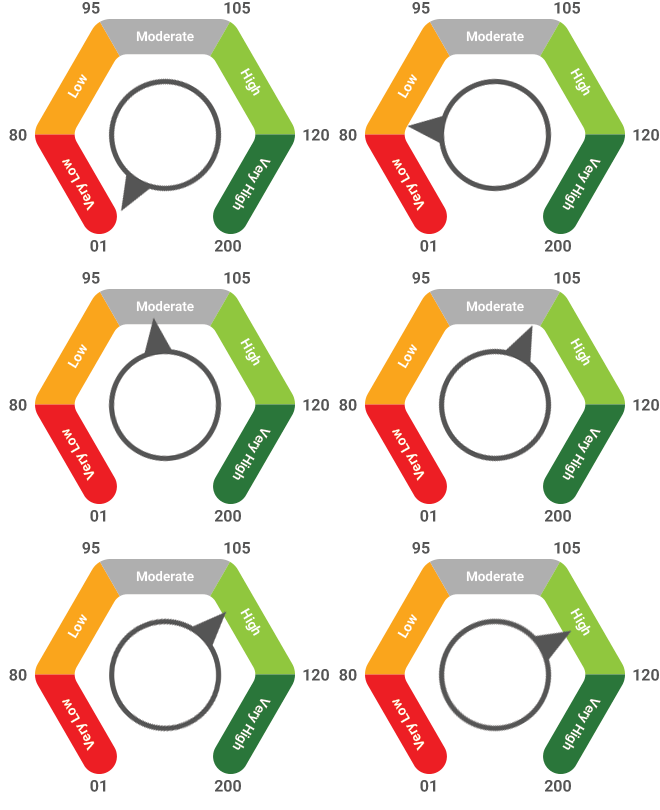
Current EMOSI reading is in the High zone (105–119), indicating a favourable risk-reward for equity investment. Continue with planned allocations.
EMOSI is derived from multiple fundamental and technical factors — P/E ratios, G-sec yields, moving average divergences, and more. Higher EMOSI = more favourable risk-reward for equity.
The People Behind the System
Every great system has architects who designed it, tested it, and committed to never overriding it.

Mr. Jimeet Modi is a Rank Holder Chartered Accountant and Founder & CEO of the SAMCO Group. Under his leadership, SAMCO operates under a wide range of financial service businesses including equity and commodity broking, depository services, equity research, mutual fund research and distribution. He has a career spanning over 15 years with rich experience in equity research, investment analysis and technology.

Mr. Umeshkumar Mehta has over 26 yearsof experience in Indian Capital Markets. Hisrole involves overseeing investmentstrategies and managing assets acrossdiverse portfolios. He has profoundknowledge of financial markets, believes indata driven approach to investments anddraws lessons from financial marketshistories. He used to lead the Samco group’sResearch team. He has been associated withthe group for the last fifteen years. He is anCA and MBA by qualification.
Frequently Asked Questions
Explore Momentum-Driven Strategies
From pure equity momentum to multi-asset rotation — find the fund that fits your risk appetite and investment horizon.