9 Lessons from the Nifty50’s journey

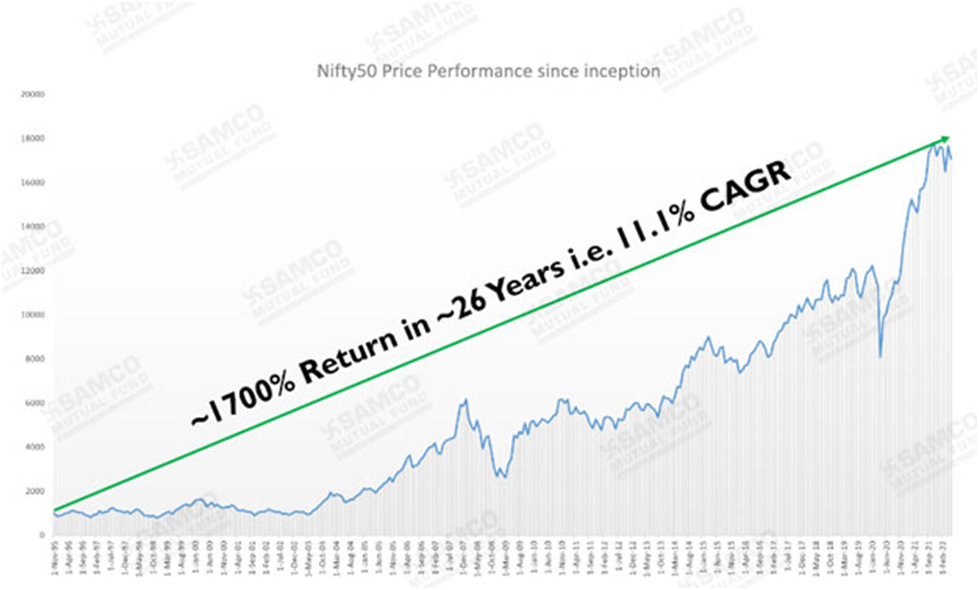
Nifty50 has had an eventful ride filled with structural changes and macro-economic cycles, right since 1995. In this period, the index has given a CAGR return of ~11% in ~27 years or an absolute return of 1700% as it has made its journey from 1000 to 17000+.
The NIFTY is in its 27th year running and there are several vital lessons from its journey. In SAMCO Mutual Fund’s first edition of the “SAMCO MF Food for thought” series, we try to spell out some of the lessons we’ve learnt from the NIFTY’s journey. The source of our learnings is a detailed look at the NIFTY’s entries and exits since inception.
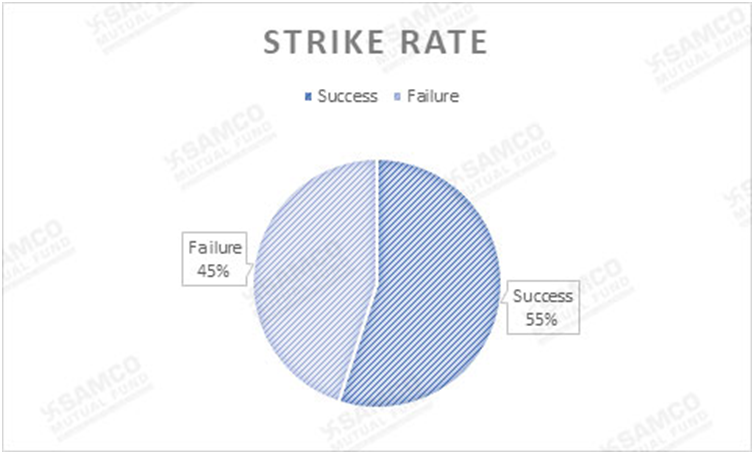
1. Strike Rate is Overrated – The NIFTY has a strike rate of only 55%
Most investors try to over optimize for win rates i.e. they anchor their investments to try and achieve a near 100% win rate on the trades/investments they make. Investors and even fund managers often want all their bets to end with a positive return. After all, who likes to be wrong?
Let us tell you a startling fact – The NIFTY has been right only 55% of the times and despite that delivered a handsome 11.31% CAGR
There have been an aggregate of 152 positions that the NIFTY has taken since inception of which only 85 have generated a win and the rest 67 have been losing positions. A complete list of all positions of the NIFTY is annexed.
Myth Busted – Generating a high return is possible even by being right just about half the times!
An obsession with win rate in investing and money management is ego driven and clearly the NIFTY has no Ego ;)
As long as investors are able to manage the overall risk-reward equation (some of which we’ve highlighted in our other learnings below), anything above a 50-60% win rate can deliver exceptional returns.
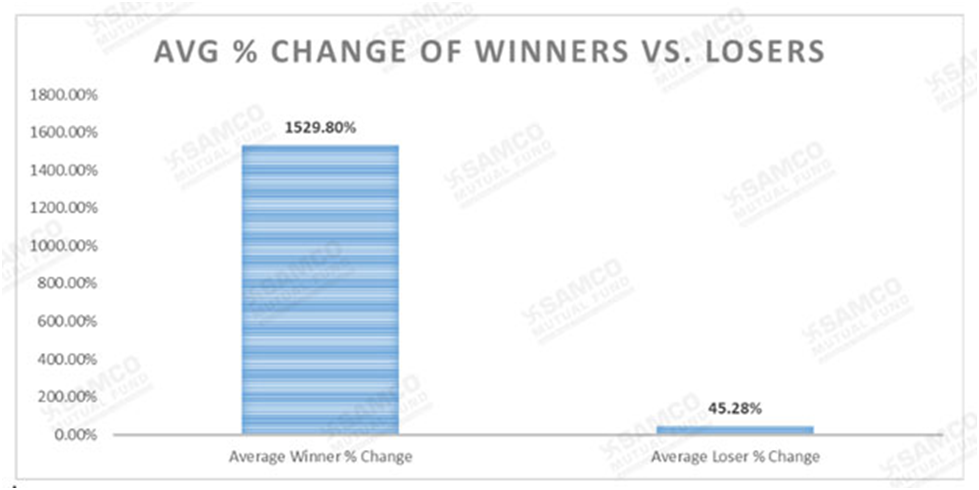
2. Let your winner’s run – NIFTY’s winners are 33 times bigger than its losers
Too often investors talk about “taking a profit” and waiting to “at least recover cost”. The fact is that if you have a profit on an investment it might be an indication that you own a share in a business which is worth holding on to. Conversely, we are all prone to run our losers, hoping they will get back to what we paid for them. This is commonly also known as the “Disposition Effect”.
Gardeners nurture flowers and pull up weeds, not the other way around.
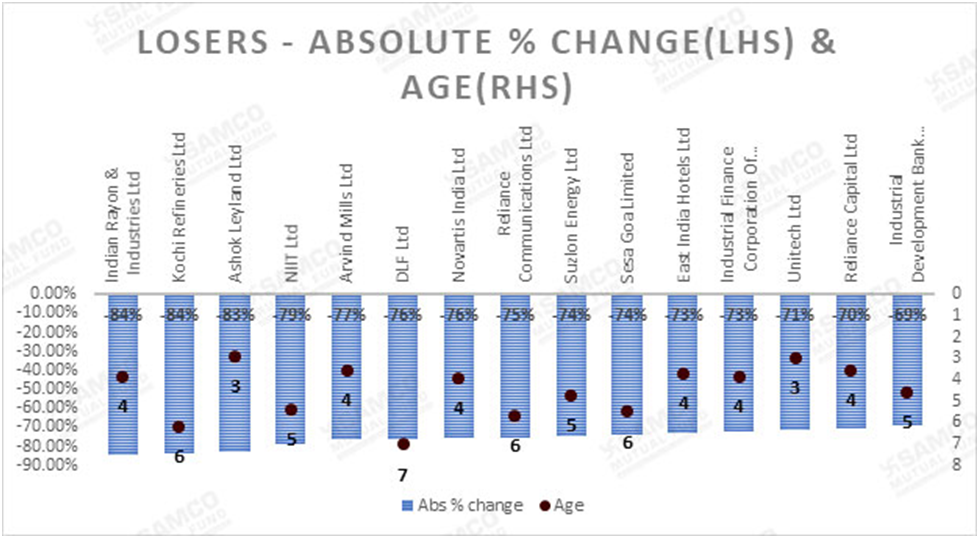
Startling Fact # 2 – NIFTY’s average winning position is +1500% and average losing position is -45%
Because of the Nifty’s algorithmic, methodical and un-emotional investing process, the NIFTY is free from cognitive biases and let’s its winners run to infinity and beyond, literally! It doesn’t book profits on its winners.
Myth Busted – You need to book profits from time to time!
The math works for Nifty, if you make money on 55% of the trades with winners being at 1500%+ and losers only at -45%, you end up with a mathematical edge and can deliver exceptional returns.
However counterintuitive it may sound, it is true that no one ever went broke taking profits but serious wealth is made only by letting your winners run for years.
3. Not only ride, let your winner’s age – NIFTY holds its winners for 3x the time it holds its losers
“If you aren't willing to own a stock for 10 years, don't even think about owning it for 10 minutes.” – Warren Buffett
The NIFTY has taken Mr. Buffett’s suggestion on holding period quite seriously. When the NIFTY initiates a position, it holds the patience of holding onto its stock for several years.
Startling Fact # 3 – NIFTY’s average winning position is held for an average of 12.5 years and the average losing position is held for about ~ 4 years
9 Stocks have been a part of the current NIFTY 50 since inception. The top contributors have been in the index for 23+ years. Losers in the NIFTY have been cut relatively faster with losers’ life in the NIFTY at ~4 years on an average since their entry i.e. 1/3rd of the time that winners are held.
This is important since most investors often give their losers a lot more time to recover in hope and give very little time to winning positions. Winning stocks in a portfolio often age like fine wine.
The Stock(s)/ Issuer(s) referred in the article, should not be construed as an investment advice or a recommendation by Samco Mutual Fund. Investors should consult their financial advisors before making any investment decision.
4. Don't need to be Hyper-active to make money – The NIFTY makes only about 4 trades a year
Buffett says, ‘The stock market is designed to transfer money from the active to the patient.’
In the urge to be busy and active, investors including fund managers engage in a lot of dealing activity. Brokers want investors to trade. Several investment advisers and mutual fund investors want their fund managers to be “active”. There are often people who ask, “Why pay a fund manager any fees. if he’s not constant churning the portfolio?.”
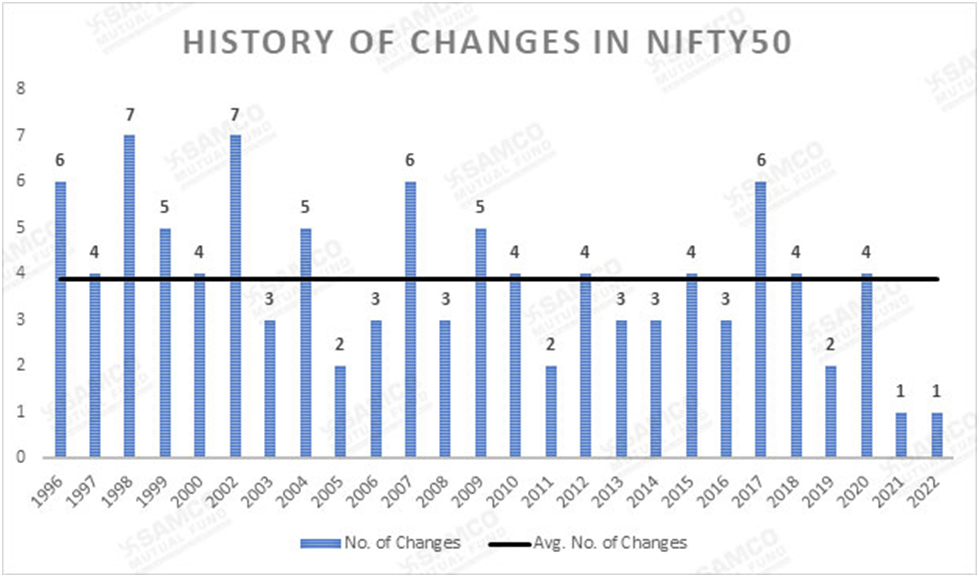
Startling Fact # 4 – NIFTY makes only about 4 trades a year!
As can be seen from NIFTY’s trades, In its long and continuing lifespan it has undergone only ~150 trades with an average of 4 stock rejigs in a year. Despite such a low churn, it has managed to deliver a 11%+ CAGR return.
Myth busted – You need to constantly churn your portfolio!
Results can be delivered even without frequent churning. In fact, as Mr. Buffett suggested, if you are patient, the market will transfer wealth back to you from the hyper active folks.
Also, another drawback of being hyper active with constant entries and exits in investing is the drag trading costs can cause to one’s portfolio.
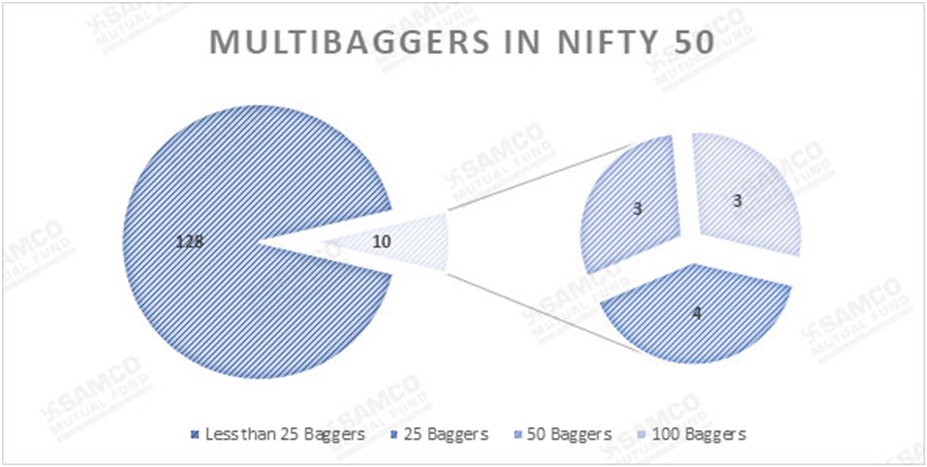
5. For a stock to be a 100-bagger it needs to be a 10-bagger first – The NIFTY only picks proven winners
Most investors are constantly in the search of the next multi-bagger. The entire investment community believes investing is a prediction game where you can only win if you are able to predict the next set of winners.
Startling Fact # 5 – NIFTY only buys proven winners. It doesn’t predict winners but instead waits for actual winners to emerge and in many cases ends up buying after a stock would be up many-fold.
A stock has always entered Nifty50 after it has already been proven a winner. This is because only if its price increases, will its free-float market capitalization increase enough for it to be added in the index. So, a stock first needs to be a 10-bagger, then a 25-bagger, then eventually it could be a 100-bagger!
Myth Busted – You need to be early to identify a stock and only then can you make a decent return!
Unlike most participants, the NIFTY doesn’t predict winners. The NIFTY waits for winners to be proven by market forces and then buys the winners. Time and again, the NIFTY has bought stocks after serious run-ups and yet has managed to deliver a great 11%+ CAGR over its lifetime. In the process of betting winners, the NIFTY has saved itself from the prediction game!
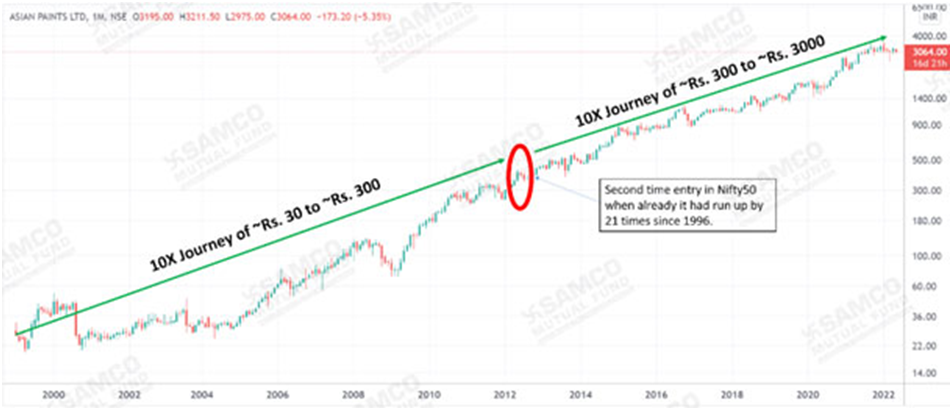
To demonstrate what we are saying as an example, Asian Paints was only included in the index in April 2012, when it had already gone up by 10 times since 2002. However, since then, the stock price has gone up by almost 10 times again.
Out of the 135+ unique stocks which have entered the index since inception, 10 stocks managed to post a 25X return, out of which 6 have advanced to become 50-baggers and 3 have emerged as “100-baggers”.
Investors would be served much better if they ended up buying companies that were already multi baggers instead of predicting which companies could be future multi baggers.
6. All you need is just 3-5 ideas in a lifetime – More than half of NIFTY’s returns have come from just 3 stocks!
Billionaire investor Warren Buffett puts it quite succinctly: “You only have to be right on a very, very few things in your lifetime as long as you never make any big mistakes. An investor needs to do very few things right as long as he or she avoids big mistakes.”
Holding a large number of stocks in your portfolio doesn’t guarantee the highest returns.
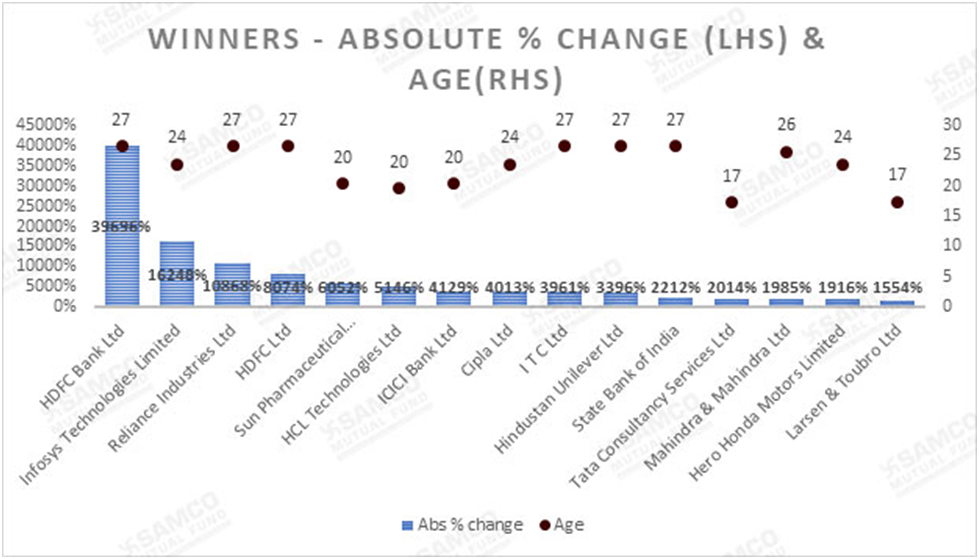
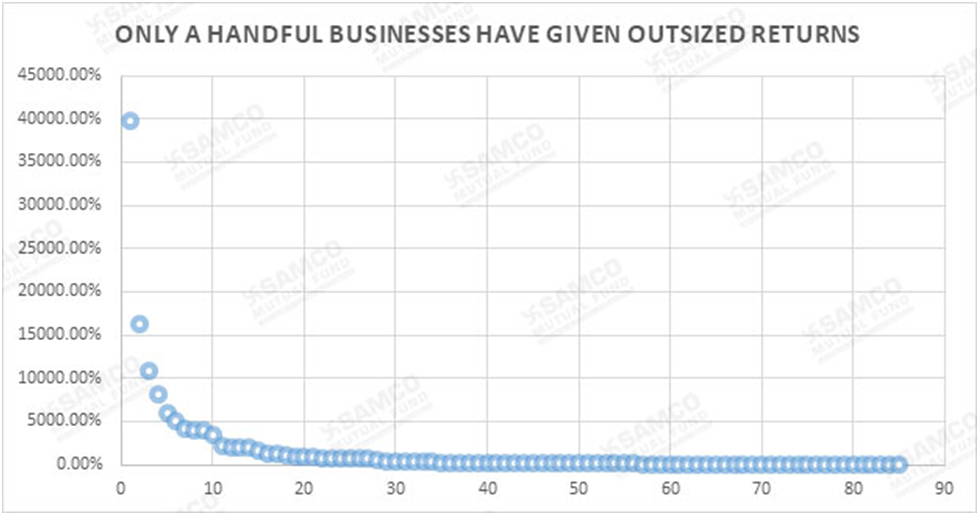
Startling Fact # 6 – If you observe Nifty50’s history, out of the 135+ unique stocks that entered, exited or have stayed in the index ONLY 3 stocks have contributed to more than half of Nifty50’s absolute returns in 27 years. HDFC Bank, Infosys and Reliance Industries have collectively delivered a sum of ~66,800% absolute returns which is more than half the returns contributed by all other constituents in the index on an absolute basis.
Myth Busted – As investors we constantly need to search for new ideas and trends to profit!
One just needs to find the right 3-5 stocks in their lifetime rather than chasing hundreds of stocks that may be subject to current fads and fancies of the market for time to time. As you can see in the below chart, only few businesses have given outsized positive returns in absolute terms while the majority have given less than 500% returns.
7. You can cut losers even faster – The NIFTY waits too long sometimes to cut its losers
While there are many things that we love about the NIFTY, there are some things that an active investor could do much better than NIFTY’s mechanical approach.
Startling Fact #7 – Despite a clearly large losing position, the NIFTY waits for a stock to fall below to its lowest rank to exit.
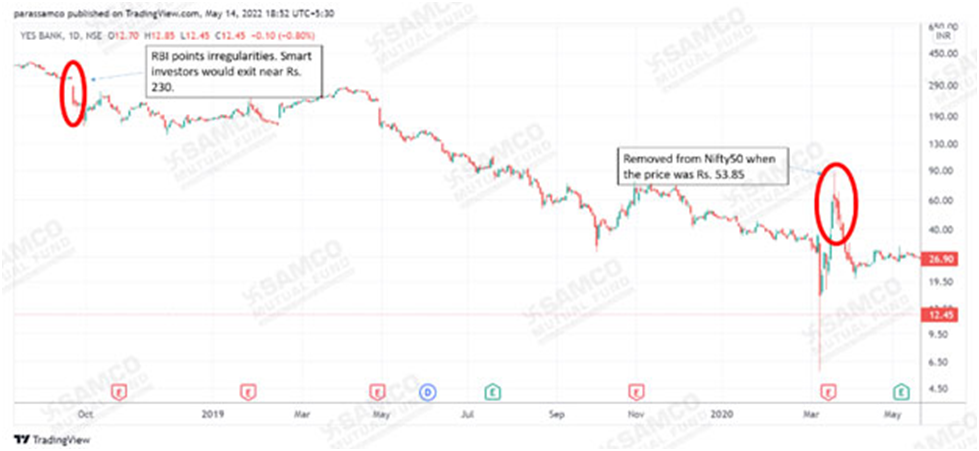
Nifty50 follows a strategy wherein it holds the top 50 liquid stocks by free float. Now unless a stock’s free float market cap falls below the 50th stock or the 51st stock’s free float market cap rises above the 50th stock, there will not be any rejig in the index. That means even if the fundamentals of the stock deteriorates or if a company is on the verge of extinction/bankruptcy, until and unless the above conditions are fulfilled the stock is not removed from the index. More often than not, it is too late and exits usually happen after the stock has deteriorated significantly which would just add to Nifty50’s losses. Hence, it is better to cut your losses even faster and not let the pain prolong.
For example, Yes Bank fell 29% in a single day on 21st September 2018 when the hints of fraud at the bank came to light when RBI pointed out irregularities in the bank. The close price on that day was Rs. 226.5 while the exit from the index happened on 19th March 2020 when it’s close price was Rs. 53.85 i.e. it was 76% further down since 21st September 2018. As traders often say, the first loss is the best loss. As investors, we need not be subject to mechanical ranking based exits on free float and hence can actually exit the party as soon as we see the first set of people puking!
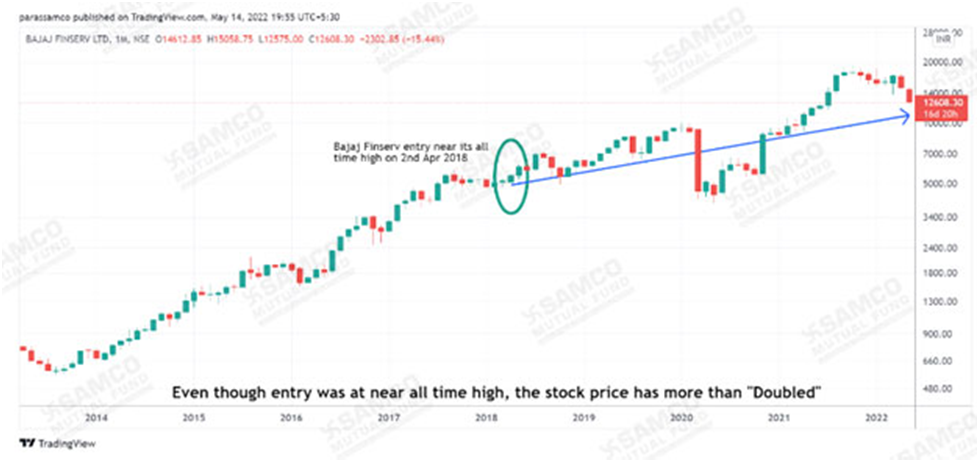
8. It’s better to buy high and sell higher than merely buying low and selling high – NIFTY makes most of its entries at All Time Highs without worrying about being late
As we have established earlier that Nifty50 only includes a business in its portfolio after it has become a proven winner. Nifty50 has a history of buying many stocks at their all-time highs. But despite that, the stocks have continued to perform well and have generated returns for investors. Hence, as counterintuitive as it may seem, it is never too late to enter a stock.
The goal is to make more on your winners than you lose on your losers and do it repeatedly. It's not about buying low and selling high, it's about buying lower than you sell. It's about making money!
9. Pick a style/method of investing and stick to it – NIFTY’s style is “Bhav Bhagwan Che”
No one can practically know EVERYTHING about a business or a company before investing in it. In fact, with proper rules and processes in place, you can still make money by investing even when you do not know anything about a company’s fundamentals, its industry or its promoter?
Wondering how is that even possible? Nify50 has done it! The criteria for a stock to enter or exit the Nifty50 “Portfolio” is the growth of its free float market capitalisation and fulfilling other criteria like impact cost, frequency of trading, etc.
It does not evaluate the financials of the business, does not meet its management, does not know what the business or industry the company operates. It doesn't track the day to day activities of the businesses but it still manages to makes money.
It is the discipline in its strategy which has enabled it to deliver a CAGR of 11% since 27 years. Because as per its discipline whichever stock experiences an increase in its free float market capitalisation to be among the top 50 band will make an entry into the index and vice versa with its exit.
Even Warren Buffett has widely quoted that ‘An idiot with a plan can beat a genius without a plan.’ Given that Nifty50 follows a process driven strategy and sticks to its process without any human interventions, it has been able to generate such returns in the long period.
List of NIFTY Entries and Exits
|
Scrip Name |
Buy Date |
Exit Date |
Buy Price (Close as on Buy
Date) |
Exit Price (Close as on Exit
Date) |
Abs. % Change |
Period |
CAGR % |
Win Loss |
|
Indian Rayon & Industries Ltd |
11/3/1995 |
9/8/1999 |
460.75 |
71.8 |
-84.42% |
3.85 |
-38.30% |
Loss |
|
Kochi Refineries Ltd |
11/3/1995 |
1/17/2002 |
161.5 |
26.6 |
-83.53% |
6.21 |
-25.20% |
Loss |
|
Ashok Leyland Ltd |
11/3/1995 |
10/7/1998 |
6.71 |
1.15 |
-82.87% |
2.93 |
-45.25% |
Loss |
|
Arvind Mills Ltd |
11/3/1995 |
5/26/1999 |
50.18 |
11.72 |
-76.65% |
3.56 |
-33.53% |
Loss |
|
Industrial Finance Corporation Of India
Ltd |
11/3/1995 |
9/8/1999 |
37.2 |
10.2 |
-72.58% |
3.85 |
-28.55% |
Loss |
|
Reliance Capital Ltd |
11/3/1995 |
5/26/1999 |
95.75 |
28.27 |
-70.47% |
3.56 |
-29.00% |
Loss |
|
Industrial Development Bank of India
Limited |
11/3/1995 |
5/24/2000 |
68.13 |
21 |
-69.17% |
4.56 |
-22.75% |
Loss |
|
Essar Gujarat Ltd |
11/3/1995 |
12/24/1997 |
48.5 |
15.55 |
-67.94% |
2.14 |
-41.19% |
Loss |
|
Mangalore Refinery & Petrochemicals
Ltd |
11/3/1995 |
10/7/1998 |
35.2 |
13.25 |
-62.36% |
2.93 |
-28.37% |
Loss |
|
Great Eastern Shipping Company Limited |
11/3/1995 |
5/26/1999 |
41.58 |
17.49 |
-57.94% |
3.56 |
-21.59% |
Loss |
|
Indo Gulf Corporation Ltd |
11/3/1995 |
10/7/1998 |
57.5 |
29.9 |
-48.00% |
2.93 |
-20.01% |
Loss |
|
Thermax Ltd |
11/3/1995 |
10/7/1998 |
63.25 |
34.06 |
-46.15% |
2.93 |
-19.05% |
Loss |
|
SCICI Ltd |
11/3/1995 |
5/14/1997 |
36.65 |
22.05 |
-39.84% |
1.53 |
-28.28% |
Loss |
|
Nagarjuna Fertilizers & Chemicals
Ltd |
11/3/1995 |
9/18/1996 |
23.85 |
14.4 |
-39.62% |
0.88 |
-43.76% |
Loss |
|
Chambal Fertilizers & Chemicals Ltd |
11/3/1995 |
9/18/1996 |
20 |
12.1 |
-39.50% |
0.88 |
-43.63% |
Loss |
|
Madras Refineries Ltd |
11/3/1995 |
9/18/1996 |
58.55 |
37 |
-36.81% |
0.88 |
-40.76% |
Loss |
|
ICICI LTD |
11/3/1995 |
5/31/2002 |
93.65 |
61.8 |
-34.01% |
6.58 |
-6.12% |
Loss |
|
Dr Reddy's Laboratories Ltd |
11/3/1995 |
5/14/1997 |
67.97 |
52.55 |
-22.68% |
1.53 |
-15.49% |
Loss |
|
Andhra Valley Power Supply Co Ltd |
11/3/1995 |
10/7/1998 |
84 |
71.65 |
-14.70% |
2.93 |
-5.28% |
Loss |
|
Colgate Palmolive (I) Ltd |
11/3/1995 |
9/26/2005 |
144.98 |
124.2 |
-14.33% |
9.90 |
-1.55% |
Loss |
|
Castrol (India) Ltd |
11/3/1995 |
5/2/2003 |
26 |
23.22 |
-10.66% |
7.50 |
-1.49% |
Loss |
|
Apollo Tyres Ltd |
11/3/1995 |
9/18/1996 |
13.99 |
13.26 |
-5.18% |
0.88 |
-5.89% |
Loss |
|
Hero Honda Motors Limited |
11/3/1995 |
9/18/1996 |
25.68 |
24.86 |
-3.18% |
0.88 |
-3.62% |
Loss |
|
BAJAJ AUTO |
11/3/1995 |
3/14/2008 |
791 |
778.35 |
-1.60% |
12.37 |
-0.13% |
Loss |
|
HDFC Bank Ltd |
11/3/1995 |
5/4/2022 |
3.41 |
1356 |
39695.56% |
26.52 |
25.33% |
Win |
|
Reliance Industries Ltd |
11/3/1995 |
5/4/2022 |
24.56 |
2693.65 |
10867.76% |
26.52 |
19.38% |
Win |
|
HDFC Ltd |
11/3/1995 |
5/4/2022 |
27 |
2206.95 |
8073.89% |
26.52 |
18.06% |
Win |
|
I T C Ltd |
11/3/1995 |
5/4/2022 |
6.4 |
259.75 |
3960.84% |
26.52 |
14.99% |
Win |
|
Hindustan Unilever Ltd |
11/3/1995 |
5/4/2022 |
62.11 |
2171.55 |
3396.22% |
26.52 |
14.34% |
Win |
|
State Bank of India |
11/3/1995 |
5/4/2022 |
20.75 |
479.65 |
2212.06% |
26.52 |
12.57% |
Win |
|
Ambuja Cements Ltd |
11/3/1995 |
4/2/2018 |
18.33 |
240.2 |
1210.19% |
22.43 |
12.16% |
Win |
|
ACC Ltd |
11/3/1995 |
9/29/2017 |
154.44 |
1656.9 |
972.87% |
21.92 |
11.43% |
Win |
|
Tata Steel Ltd |
11/3/1995 |
5/4/2022 |
131.08 |
1261.35 |
862.28% |
26.52 |
8.91% |
Win |
|
Hindalco Industries Ltd |
11/3/1995 |
5/4/2022 |
54.85 |
461.65 |
741.70% |
26.52 |
8.36% |
Win |
|
Tata Power Co Ltd |
11/3/1995 |
9/29/2017 |
11.51 |
77.8 |
575.78% |
21.92 |
9.11% |
Win |
|
Tata Motors Ltd |
11/3/1995 |
5/4/2022 |
79.56 |
423.5 |
432.32% |
26.52 |
6.51% |
Win |
|
Grasim Industries Ltd |
11/3/1995 |
4/8/2010 |
84.92 |
395.9 |
366.22% |
14.44 |
11.25% |
Win |
|
Indian Petrochemicals Corporation Ltd |
11/3/1995 |
10/5/2007 |
127 |
483.1 |
280.39% |
11.93 |
11.85% |
Win |
|
Ranbaxy Laboratories Ltd |
11/3/1995 |
3/28/2014 |
100 |
363.85 |
263.85% |
18.41 |
7.27% |
Win |
|
Oriental Bank of Commerce |
11/3/1995 |
4/4/2007 |
61.2 |
176.55 |
188.48% |
11.42 |
9.72% |
Win |
|
Reliance Infrastructure Ltd |
11/3/1995 |
9/27/2013 |
150.3 |
392.35 |
161.04% |
17.91 |
5.50% |
Win |
|
Tata Tea Limited |
11/3/1995 |
9/1/2006 |
35.77 |
81.87 |
128.88% |
10.84 |
7.94% |
Win |
|
Larsen &toubro ltd |
11/3/1995 |
5/24/2004 |
42.53 |
76.29 |
79.39% |
8.56 |
7.06% |
Win |
|
Ponds (India) Ltd |
11/3/1995 |
10/7/1998 |
852 |
1223.05 |
43.55% |
2.93 |
13.14% |
Win |
|
Brooke Bond Lipton India Ltd |
11/3/1995 |
5/7/1997 |
318.65 |
452.35 |
41.96% |
1.51 |
26.12% |
Win |
|
Reliance Petroleum Ltd |
11/3/1995 |
10/10/2002 |
18.9 |
21.6 |
14.29% |
6.94 |
1.94% |
Win |
|
Indian Aluminium Co Ltd |
11/3/1995 |
9/18/1996 |
54.85 |
59.07 |
7.69% |
0.88 |
8.82% |
Win |
|
Tata Chemicals Ltd |
11/3/1995 |
6/27/2006 |
88.99 |
94.69 |
6.41% |
10.65 |
0.58% |
Win |
|
Indian Hotels Co Ltd |
11/3/1995 |
2/25/2005 |
42.63 |
45.26 |
6.18% |
9.32 |
0.65% |
Win |
|
TVS Suzuki Ltd |
11/3/1995 |
5/10/2000 |
264 |
271 |
2.65% |
4.52 |
0.58% |
Win |
|
East India Hotels Ltd |
9/18/1996 |
5/24/2000 |
47.36 |
12.87 |
-72.82% |
3.68 |
-29.80% |
Loss |
|
Mahindra & Mahindra Ltd |
9/18/1996 |
5/4/2022 |
42.97 |
896.1 |
1985.41% |
25.64 |
12.58% |
Win |
|
ABB India Ltd |
9/18/1996 |
10/1/2010 |
109.69 |
830.15 |
656.78% |
14.04 |
15.50% |
Win |
|
Glaxo (India) Ltd |
9/18/1996 |
3/14/2008 |
114.77 |
518.49 |
351.75% |
11.49 |
14.02% |
Win |
|
Nestle India Ltd |
9/18/1996 |
8/4/2003 |
245 |
572 |
133.47% |
6.88 |
13.12% |
Win |
|
Asian Paints Ltd |
9/18/1996 |
10/28/2002 |
15.4 |
22.18 |
44.02% |
6.11 |
6.15% |
Win |
|
Mahanagar Telephone Nigam Ltd |
5/7/1997 |
12/12/2007 |
282.05 |
193.2 |
-31.50% |
10.61 |
-3.50% |
Loss |
|
Bharat Heavy Electricals Ltd |
5/14/1997 |
3/31/2017 |
28.24 |
108.57 |
284.49% |
19.89 |
7.00% |
Win |
|
Hindustan Petroleum Corporation Ltd |
5/14/1997 |
12/12/2007 |
62.41 |
73.79 |
18.24% |
10.59 |
1.60% |
Win |
|
Bharat Petroleum Corporation Ltd |
12/24/1997 |
10/7/1998 |
30.18 |
17.44 |
-42.22% |
0.79 |
-50.22% |
Loss |
|
NIIT Ltd |
10/7/1998 |
3/1/2004 |
119.97 |
25.29 |
-78.92% |
5.40 |
-25.03% |
Loss |
|
Bank of India |
10/7/1998 |
9/1/2000 |
25.55 |
10 |
-60.86% |
1.90 |
-38.90% |
Loss |
|
Procter & Gamble India Ltd |
10/7/1998 |
10/28/2002 |
477.98 |
230.52 |
-51.77% |
4.06 |
-16.44% |
Loss |
|
Smithkline Beecham Consumer Healthcare
Ltd |
10/7/1998 |
3/1/2004 |
480 |
277.3 |
-42.23% |
5.40 |
-9.66% |
Loss |
|
Infosys Technologies Limited |
10/7/1998 |
5/4/2022 |
9.39 |
1535.55 |
16247.76% |
23.59 |
24.12% |
Win |
|
Cipla Ltd |
10/7/1998 |
5/4/2022 |
23.28 |
957.55 |
4012.81% |
23.59 |
17.07% |
Win |
|
Hero Honda Motors Limited |
10/7/1998 |
5/4/2022 |
119.55 |
2409.5 |
1915.53% |
23.59 |
13.58% |
Win |
|
Novartis India Ltd |
5/26/1999 |
5/2/2003 |
900 |
219.5 |
-75.61% |
3.94 |
-30.12% |
Loss |
|
Reckitt & Colman India Ltd |
5/26/1999 |
1/25/2002 |
475 |
159.35 |
-66.45% |
2.67 |
-33.56% |
Loss |
|
Dr Reddy's Laboratories Ltd |
5/26/1999 |
9/10/2008 |
203.31 |
567.6 |
179.19% |
9.30 |
11.67% |
Win |
|
Satyam Computer Services Ltd |
9/8/1999 |
1/12/2009 |
92.67 |
34.4 |
-62.88% |
9.35 |
-10.05% |
Loss |
|
Britannia Industries Ltd |
9/8/1999 |
12/10/2004 |
102.13 |
80 |
-21.66% |
5.26 |
-4.54% |
Loss |
|
Dabur India Ltd |
5/10/2000 |
9/24/2007 |
11.91 |
53.5 |
349.30% |
7.38 |
22.59% |
Win |
|
HCL Infosystems Ltd |
5/24/2000 |
1/17/2002 |
63.33 |
21.15 |
-66.60% |
1.65 |
-48.51% |
Loss |
|
Zee Telefilms Ltd |
5/24/2000 |
3/27/2009 |
164 |
425.4 |
159.39% |
8.85 |
11.38% |
Win |
|
Digital Equipment (india) Ltd |
9/1/2000 |
4/12/2004 |
533.8 |
834.55 |
56.34% |
3.61 |
13.16% |
Win |
|
Sun Pharmaceutical Industries Ltd |
1/17/2002 |
5/4/2022 |
14.64 |
900.9 |
6052.23% |
20.31 |
22.49% |
Win |
|
Wipro Ltd |
1/17/2002 |
4/1/2013 |
57.73 |
142.03 |
146.04% |
11.21 |
8.36% |
Win |
|
ICICI Bank Ltd |
1/25/2002 |
5/4/2022 |
17.13 |
724.25 |
4128.64% |
20.28 |
20.27% |
Win |
|
Videsh Sanchar Nigam Ltd |
5/31/2002 |
10/22/2009 |
186.7 |
281.6 |
50.83% |
7.40 |
5.71% |
Win |
|
Shipping Corporation of India Ltd |
10/10/2002 |
6/27/2006 |
49.97 |
92.57 |
85.26% |
3.72 |
18.05% |
Win |
|
HCL Technologies Ltd |
10/28/2002 |
5/4/2022 |
19.92 |
1044.95 |
5145.96% |
19.53 |
22.48% |
Win |
|
Bharat Petroleum Corporation Ltd |
10/28/2002 |
5/4/2022 |
28.48 |
363.45 |
1175.94% |
19.53 |
13.93% |
Win |
|
Gas Authority of India Limited |
5/2/2003 |
3/31/2021 |
15.16 |
135.5 |
793.84% |
17.93 |
13.00% |
Win |
|
National Aluminium Co Ltd |
5/2/2003 |
10/22/2009 |
21.5 |
89.2 |
314.88% |
6.48 |
24.56% |
Win |
|
Steel Authority of India Ltd |
8/4/2003 |
9/28/2012 |
24.05 |
85.45 |
255.30% |
9.16 |
14.85% |
Win |
|
Maruti Udyog Limited |
3/1/2004 |
5/4/2022 |
514.55 |
7397.9 |
1337.74% |
18.19 |
15.79% |
Win |
|
Bharti Tele-Ventures Ltd |
3/1/2004 |
5/4/2022 |
73.43 |
722.4 |
883.79% |
18.19 |
13.40% |
Win |
|
Oil & Natural Gas Corporation Ltd |
4/12/2004 |
5/4/2022 |
97.19 |
162.25 |
66.93% |
18.07 |
2.88% |
Win |
|
Punjab National Bank |
5/24/2004 |
4/1/2016 |
53.43 |
87.65 |
64.05% |
11.86 |
4.26% |
Win |
|
Larsen & Toubro Ltd |
12/10/2004 |
5/4/2022 |
98.77 |
1633.95 |
1554.28% |
17.41 |
17.49% |
Win |
|
Tata Consultancy Services Ltd |
2/25/2005 |
5/4/2022 |
164.61 |
3479.75 |
2013.97% |
17.20 |
19.41% |
Win |
|
Jet Airways (India) Ltd |
9/26/2005 |
4/4/2007 |
1115.65 |
615.65 |
-44.82% |
1.52 |
-32.36% |
Loss |
|
Suzlon Energy Ltd |
6/27/2006 |
3/25/2011 |
178.39 |
45.5 |
-74.49% |
4.75 |
-25.02% |
Loss |
|
Siemens Ltd |
6/27/2006 |
4/1/2013 |
410.49 |
517.25 |
26.01% |
6.77 |
3.48% |
Win |
|
Reliance Communications Ltd |
9/1/2006 |
4/27/2012 |
299.9 |
74.25 |
-75.24% |
5.66 |
-21.87% |
Loss |
|
Sterlite Industries (India) Ltd |
4/4/2007 |
9/28/2012 |
117.43 |
99.55 |
-15.22% |
5.49 |
-2.96% |
Loss |
|
Reliance Petroleum Ltd |
4/4/2007 |
6/17/2009 |
71.8 |
127.35 |
77.37% |
2.21 |
29.67% |
Win |
|
NTPC Ltd |
9/24/2007 |
5/4/2022 |
149.04 |
158.65 |
6.45% |
14.62 |
0.43% |
Win |
|
Unitech Ltd |
10/5/2007 |
10/1/2010 |
327.85 |
94.3 |
-71.24% |
2.99 |
-34.06% |
Loss |
|
Idea Cellular Ltd |
12/12/2007 |
10/1/2010 |
83.87 |
44.42 |
-47.03% |
2.81 |
-20.27% |
Loss |
|
Cairn India Ltd |
12/12/2007 |
4/1/2016 |
218 |
153.25 |
-29.70% |
8.31 |
-4.15% |
Loss |
|
DLF Ltd |
3/14/2008 |
3/27/2015 |
653.6 |
154.95 |
-76.29% |
7.04 |
-18.50% |
Loss |
|
Power Grid Corporation of India Ltd |
3/14/2008 |
5/4/2022 |
70.66 |
237.6 |
236.26% |
14.15 |
8.95% |
Win |
|
Reliance Power Ltd |
9/10/2008 |
4/27/2012 |
170.1 |
100.7 |
-40.80% |
3.63 |
-13.45% |
Loss |
|
Reliance Capital Ltd |
1/12/2009 |
10/10/2011 |
367.15 |
282.33 |
-23.10% |
2.74 |
-9.13% |
Loss |
|
Axis Bank Ltd |
3/27/2009 |
5/4/2022 |
86.21 |
707.2 |
720.32% |
13.11 |
17.41% |
Win |
|
Jindal Steel & Power Ltd |
6/17/2009 |
3/27/2015 |
417.27 |
157.2 |
-62.33% |
5.78 |
-15.54% |
Loss |
|
Jaiprakash Associates Ltd |
10/22/2009 |
3/28/2014 |
158.63 |
52.4 |
-66.97% |
4.43 |
-22.11% |
Loss |
|
Infrastructure Development Finance
Company Limited |
10/22/2009 |
5/29/2015 |
76.7 |
75.77 |
-1.21% |
5.60 |
-0.22% |
Loss |
|
Kotak Mahindra Bank Ltd |
4/8/2010 |
5/4/2022 |
196.53 |
1775.6 |
803.50% |
12.08 |
19.99% |
Win |
|
Sesa Goa Limited |
10/1/2010 |
4/1/2016 |
345.05 |
90.05 |
-73.90% |
5.50 |
-21.66% |
Loss |
|
Dr Reddy's Laboratories Ltd |
10/1/2010 |
5/4/2022 |
1484.55 |
3992.35 |
168.93% |
11.60 |
8.90% |
Win |
|
Bajaj Auto Ltd |
10/1/2010 |
5/4/2022 |
1547.45 |
3496.9 |
125.98% |
11.60 |
7.28% |
Win |
|
Grasim Industries Ltd |
3/25/2011 |
5/26/2017 |
404.6 |
905.3 |
123.75% |
6.18 |
13.93% |
Win |
|
Coal India Ltd |
10/10/2011 |
5/4/2022 |
343.65 |
187.35 |
-45.48% |
10.57 |
-5.58% |
Loss |
|
Bank of Baroda |
4/27/2012 |
9/29/2017 |
152.05 |
137.6 |
-9.50% |
5.43 |
-1.82% |
Loss |
|
Asian Paints Ltd |
27-Apr-12 |
5/4/2022 |
351.72 |
3100.85 |
781.63% |
10.02 |
24.25% |
Win |
|
UltraTech Cement Ltd |
9/28/2012 |
5/4/2022 |
1967.85 |
6521.95 |
231.43% |
9.60 |
13.29% |
Win |
|
Lupin Ltd |
9/28/2012 |
9/28/2018 |
595.95 |
900.95 |
51.18% |
6.00 |
7.13% |
Win |
|
NMDC Ltd |
4/1/2013 |
9/28/2015 |
135.15 |
93.45 |
-30.85% |
2.49 |
-13.76% |
Loss |
|
IndusInd Bank Ltd |
4/1/2013 |
5/4/2022 |
415.7 |
978.3 |
135.34% |
9.10 |
9.87% |
Win |
|
Wipro Ltd |
9/27/2013 |
5/4/2022 |
178.44 |
491.75 |
175.58% |
8.61 |
12.50% |
Win |
|
United Spirits Ltd |
3/28/2014 |
9/19/2014 |
531.91 |
470.7 |
-11.51% |
0.48 |
-22.51% |
Loss |
|
Tech Mahindra Ltd |
3/28/2014 |
5/4/2022 |
435.12 |
1212.8 |
178.73% |
8.11 |
13.48% |
Win |
|
Zee Entertainment Enterprises Ltd |
9/19/2014 |
9/25/2020 |
313.4 |
198.2 |
-36.76% |
6.02 |
-7.33% |
Loss |
|
Yes Bank Ltd |
3/27/2015 |
19-Mar-20 |
163.2 |
53.85 |
-67.00% |
4.98 |
-19.95% |
Loss |
|
Idea Cellular Ltd |
3/27/2015 |
3/31/2017 |
104.07 |
51.85 |
-50.17% |
2.01 |
-29.25% |
Loss |
|
Bosch Ltd |
5/29/2015 |
4/2/2018 |
23668.85 |
18515 |
-21.77% |
2.85 |
-8.27% |
Loss |
|
Adani Ports and Special Economic Zone
Ltd |
9/28/2015 |
5/4/2022 |
307.2 |
812.8 |
164.58% |
6.60 |
15.88% |
Win |
|
Bharti Infratel Ltd |
4/1/2016 |
9/25/2020 |
358.55 |
169.98 |
-52.59% |
4.49 |
-15.32% |
Loss |
|
Tata Motors Ltd DVR |
4/1/2016 |
9/29/2017 |
286.05 |
222.3 |
-22.29% |
1.50 |
-15.51% |
Loss |
|
Aurobindo Pharma Ltd |
4/1/2016 |
4/2/2018 |
729.9 |
592.55 |
-18.82% |
2.00 |
-9.89% |
Loss |
|
Eicher Motors Ltd |
4/1/2016 |
5/4/2022 |
1925.41 |
2483.2 |
28.97% |
6.09 |
4.26% |
Win |
|
Indiabulls Housing Finance Ltd |
3/31/2017 |
9/27/2019 |
997.75 |
390.1 |
-60.90% |
2.49 |
-31.39% |
Loss |
|
Indian Oil Corporation Ltd |
3/31/2017 |
3/31/2022 |
193.53 |
118.95 |
-38.54% |
5.00 |
-9.27% |
Loss |
|
Vedanta Ltd |
5/26/2017 |
7/31/2020 |
242.65 |
113.8 |
-53.10% |
3.18 |
-21.17% |
Loss |
|
Hindustan Petroleum Corporation Ltd |
9/29/2017 |
3/29/2019 |
426.8 |
283.85 |
-33.49% |
1.50 |
-23.86% |
Loss |
|
Bajaj Finance Ltd |
9/29/2017 |
5/4/2022 |
1838.05 |
6339.75 |
244.92% |
4.60 |
30.91% |
Win |
|
UPL Ltd |
9/29/2017 |
5/4/2022 |
519 |
824.2 |
58.81% |
4.60 |
10.58% |
Win |
|
Bajaj Finserv Ltd |
4/2/2018 |
5/4/2022 |
5267.4 |
14322.45 |
171.91% |
4.09 |
27.70% |
Win |
|
Titan Company Ltd |
4/2/2018 |
5/4/2022 |
944.1 |
2289.95 |
142.55% |
4.09 |
24.19% |
Win |
|
Grasim Industries Ltd |
4/2/2018 |
5/4/2022 |
1086.35 |
1622.25 |
49.33% |
4.09 |
10.30% |
Win |
|
JSW Steel Ltd |
9/28/2018 |
5/4/2022 |
381.65 |
711.55 |
86.44% |
3.60 |
18.89% |
Win |
|
Britannia Industries Ltd |
3/29/2019 |
5/4/2022 |
3074.09 |
3385.45 |
10.13% |
3.10 |
3.16% |
Win |
|
Nestle India Ltd |
9/27/2019 |
5/4/2022 |
13740.9 |
18087.75 |
31.63% |
2.60 |
11.14% |
Win |
|
Shree Cement Ltd |
3/19/2020 |
5/4/2022 |
17731.45 |
25193.5 |
42.08% |
2.13 |
17.96% |
Win |
|
HDFC Life Insurance Company Ltd |
7/31/2020 |
5/4/2022 |
627.1 |
567.6 |
-9.49% |
1.76 |
-5.51% |
Loss |
|
Divi's Laboratories Ltd. |
9/25/2020 |
5/4/2022 |
3060.75 |
4344.15 |
41.93% |
1.61 |
24.37% |
Win |
|
SBI Life Insurance Company Ltd. |
9/25/2020 |
5/4/2022 |
797.05 |
1077.85 |
35.23% |
1.61 |
20.68% |
Win |
|
Tata Consumer Products Ltd. |
3/31/2021 |
5/4/2022 |
638.9 |
803.3 |
25.73% |
1.09 |
23.30% |
Win |
|
Apollo Hospitals Enterprise Ltd |
3/31/2022 |
5/4/2022 |
4516.1 |
4013.3 |
-11.13% |
0.09 |
-71.84% |
Loss |
Important Notes:
- Constituents' weightages have not been considered in calculating returns.
- Dividends have not been considered in calculating returns.
- Prices have been adjusted for corporate actions.
Disclosures
The Stock(s)/ Issuer(s) referred in the document, should not be construed as an investment advice or a recommendation by Samco Mutual Fund.
As of December 31, 2022, Samco Mutual Fund is having exposure in the following stocks in its scheme:
Samco Flexi Cap Fund
| Issuer | % to Net Assets |
| Bajaj Finserv Ltd | 8.71% |
| Bajaj Finance Ltd | 8.2% |
| Tata Consultancy Services Ltd | 8.16% |
| Coforge Limited | 6.83% |
| Computer Age Management Services Limited | 5.66% |
| Jubilant Foodworks Ltd | 5.07% |
| L&T Technology Services Limited | 4.84% |
| Aditya Birla Capital Limited | 4.76% |
| J B Chemicals and Pharma Ltd | 4.71% |
| Pidilite Industries Ltd | 4.52% |
| Dabur India Ltd | 4.47% |
| Supreme Industries Limited | 4.47% |
| LTIMindtree Limited | 4.36% |
| ICICI Lombard General Insurance Company Ltd | 4.17% |
| Asian Paints Ltd | 3.88% |
| Crompton Greaves Consumer Electricals Limited | 3.88% |
| Divis Laboratories Ltd | 2.91% |
| Godrej Consumer Products Ltd | 2.64% |
| Balkrishna Industries Ltd | 1.56% |
Samco ELSS Tax Saver Fund
| Issuer | % to Net Assets |
| Coforge Limited | 1.29% |
| Colgate Palmolive India Ltd | 0.51% |
| Procter & Gamble Hygiene and Health Care Ltd | 0.48% |
| Computer Age Management Services Limited | 0.37% |
| Mphasis Ltd | 0.33% |
| Coromandel International Ltd | 0.29% |
| Pfizer Ltd | 0.29% |
| Multi Commodity Exchange of India Ltd | 0.26% |
| AU Small Finance Bank Limited | 0.22% |
| Ajanta Pharma Ltd | 0.2% |
| APL Apollo Tubes Limited | 0.18% |
| Jubilant Foodworks Ltd | 0.17% |
| Vinati Organics Limited | 0.17% |
| Suven Pharmaceuticals Limited | 0.16% |
| Emami Ltd | 0.14% |
| Persistent Systems Ltd | 0.13% |
| L&T Technology Services Limited | 0.12% |
| Crompton Greaves Consumer Electricals Limited | 0.11% |
| Crisil Ltd | 0.1% |
| Poonawalla Fincorp Limited | 0.1% |
| Balkrishna Industries Ltd | 0.07% |
| Devyani International Limited | 0.06% |
| Grindwell Norton Ltd | 0.06% |
| Aditya Birla Capital Limited | 0.05% |
| Supreme Industries Limited | 0.04% |
Disclaimer
In the preparation of the material contained in this document, the AMC has used information that is publicly available, including information developed in-house. However, the AMC does not warrant the accuracy, reasonableness and/ or completeness of any information.
The information provided is not intended to be used by investors as the sole basis for investment decisions, who must make their own investment decisions, based on their own investment objectives, financial positions and needs of specific investor.
Investors are advised to consult their own legal tax and financial advisors to determine possible tax, legal and other financial implication or consequence of subscribing to the units of Samco Mutual Fund. The information contained herein should not be construed as a forecast or promise nor should it be considered as an investment advice.
The AMC (including its affiliates), the Mutual Fund, the trust and any of its officers, directors, personnel and employees, shall not be liable for any loss, damage of any nature, including but not limited to direct, indirect, punitive, special, exemplary, consequential, as also any loss of profit in any way arising from the use of this material in any manner.